NIFTY 50 TOP GAINERS
NIFTY 50 WEEKLY LOSERS
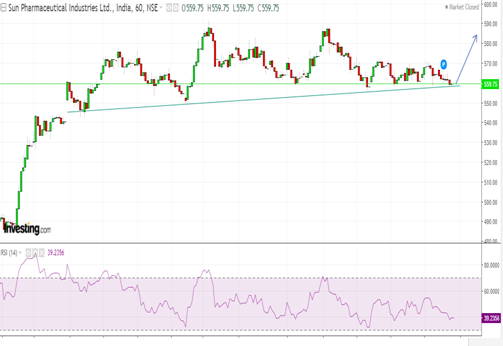
TECHNICAL ANALYSIS STOCK SUNPHARMA CHART
NIFTY 50 WEEKLY LOSERS
TECHNICAL ANALYSIS STOCK SUNPHARMA CHART
The share price of Sun Pharma has seen a sharp rebound in
first half of June 2018 after forming a bullish double bottom around 435
levels. In the last four weeks it is seen consolidating in a narrow range thus
forming base for the next up move.
· The stock during mid-June 2018 has Registered
a resolute breakout above the falling trend line joining the high of August
2016 (855) and February 2018 (609) placed at540 levels. The index in the last
four weeks is consolidating in a range above the trend line breakout area and
the 52 weeks EMA as can be seen in adjacent chart signaling higher base
formation in the stock.
· Weekly MACD in uptrend and hasrecently moved
into positiveterritory thus supports the bullishbias in the stock.
· We expect the stock to headtowards 622 levels
in the coming Month as it is the 61.8%retracement of the entire CY 2017 decline
729 to433.
· Pharma sector has remained in focus
throughout in June and many stocks from the sector have formed trend reversal
patterns on the charts.
Buying
Sun Pharma future currently levels for the upside target of Rs 590 and 625 keep
a stop loss placed at Rs 545.
Stock
resistance (daily)
·
Resistance 1
- 575
·
Resistance
2 -
599
·
Resistance
3 -
661
Stock Support (daily)
·
Support 1 -
548
·
Support 2 - 527
·
Support 3 -
461


No comments:
Post a Comment